Table and Excel analysis
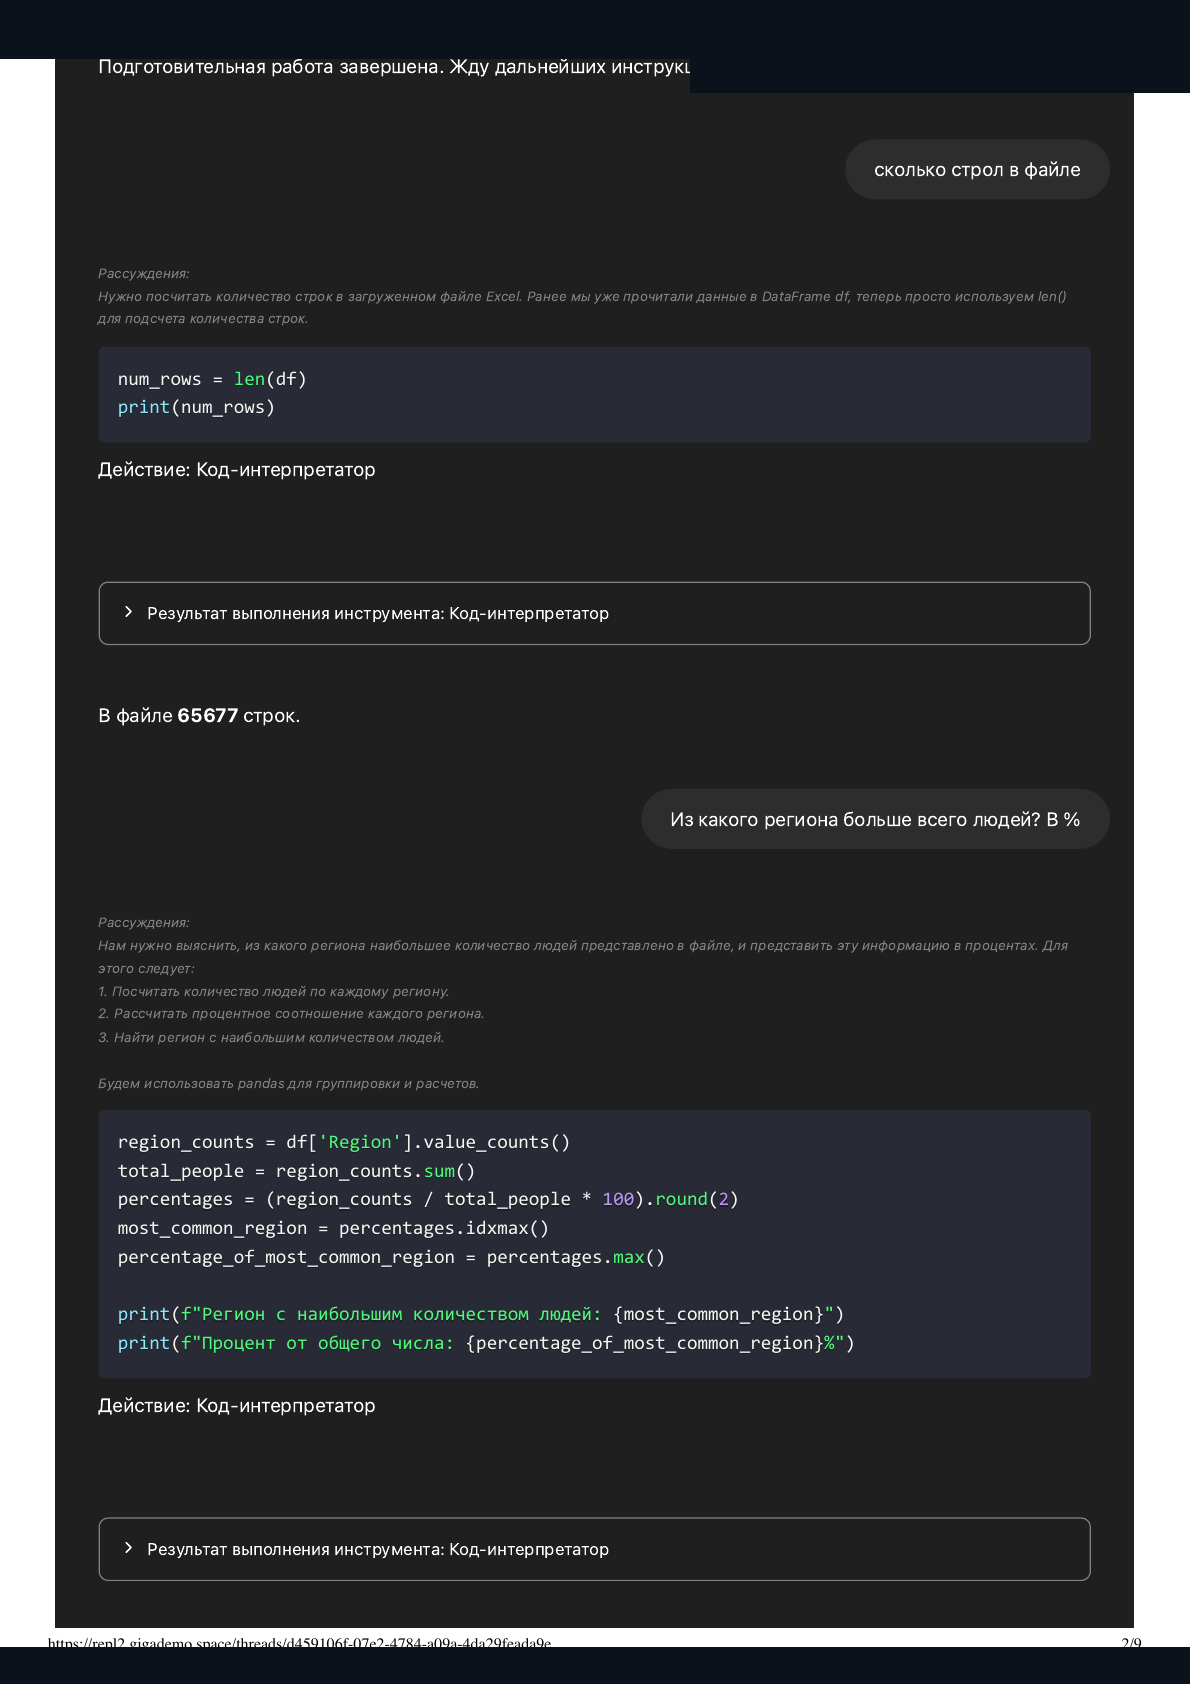
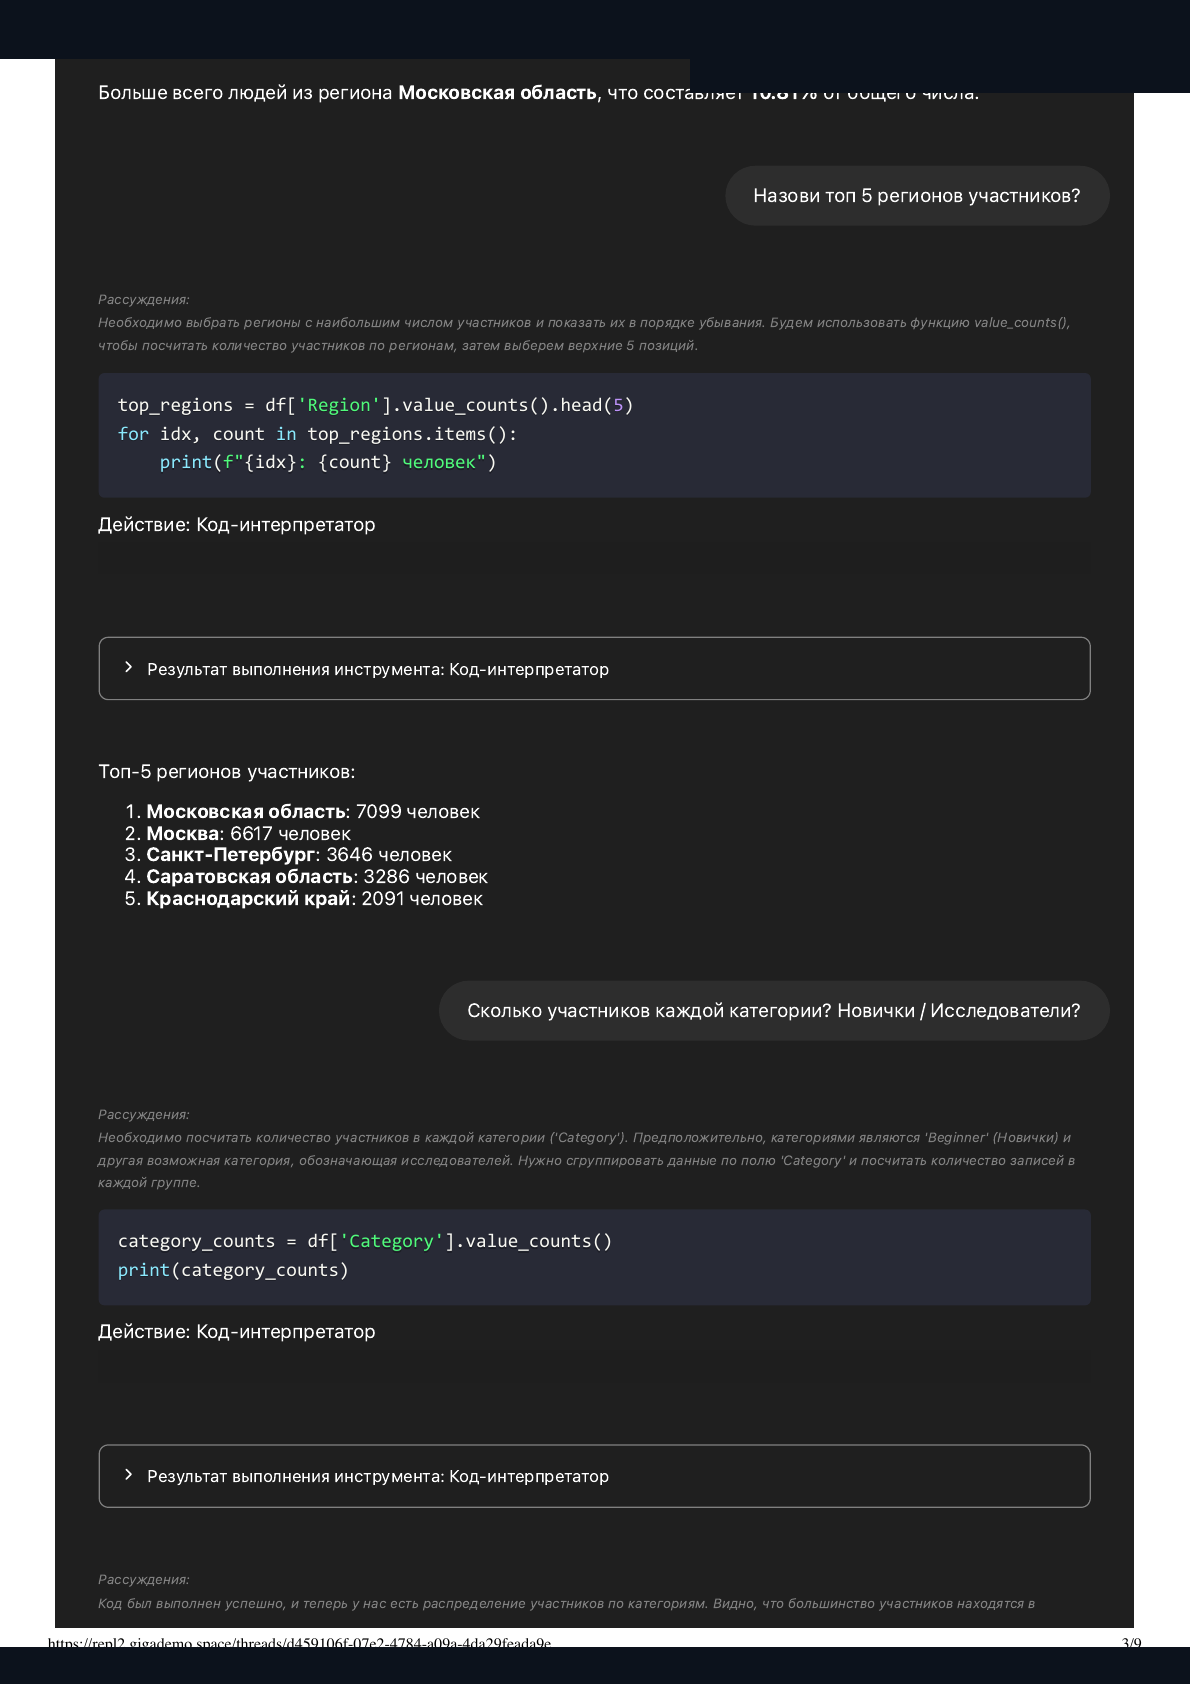
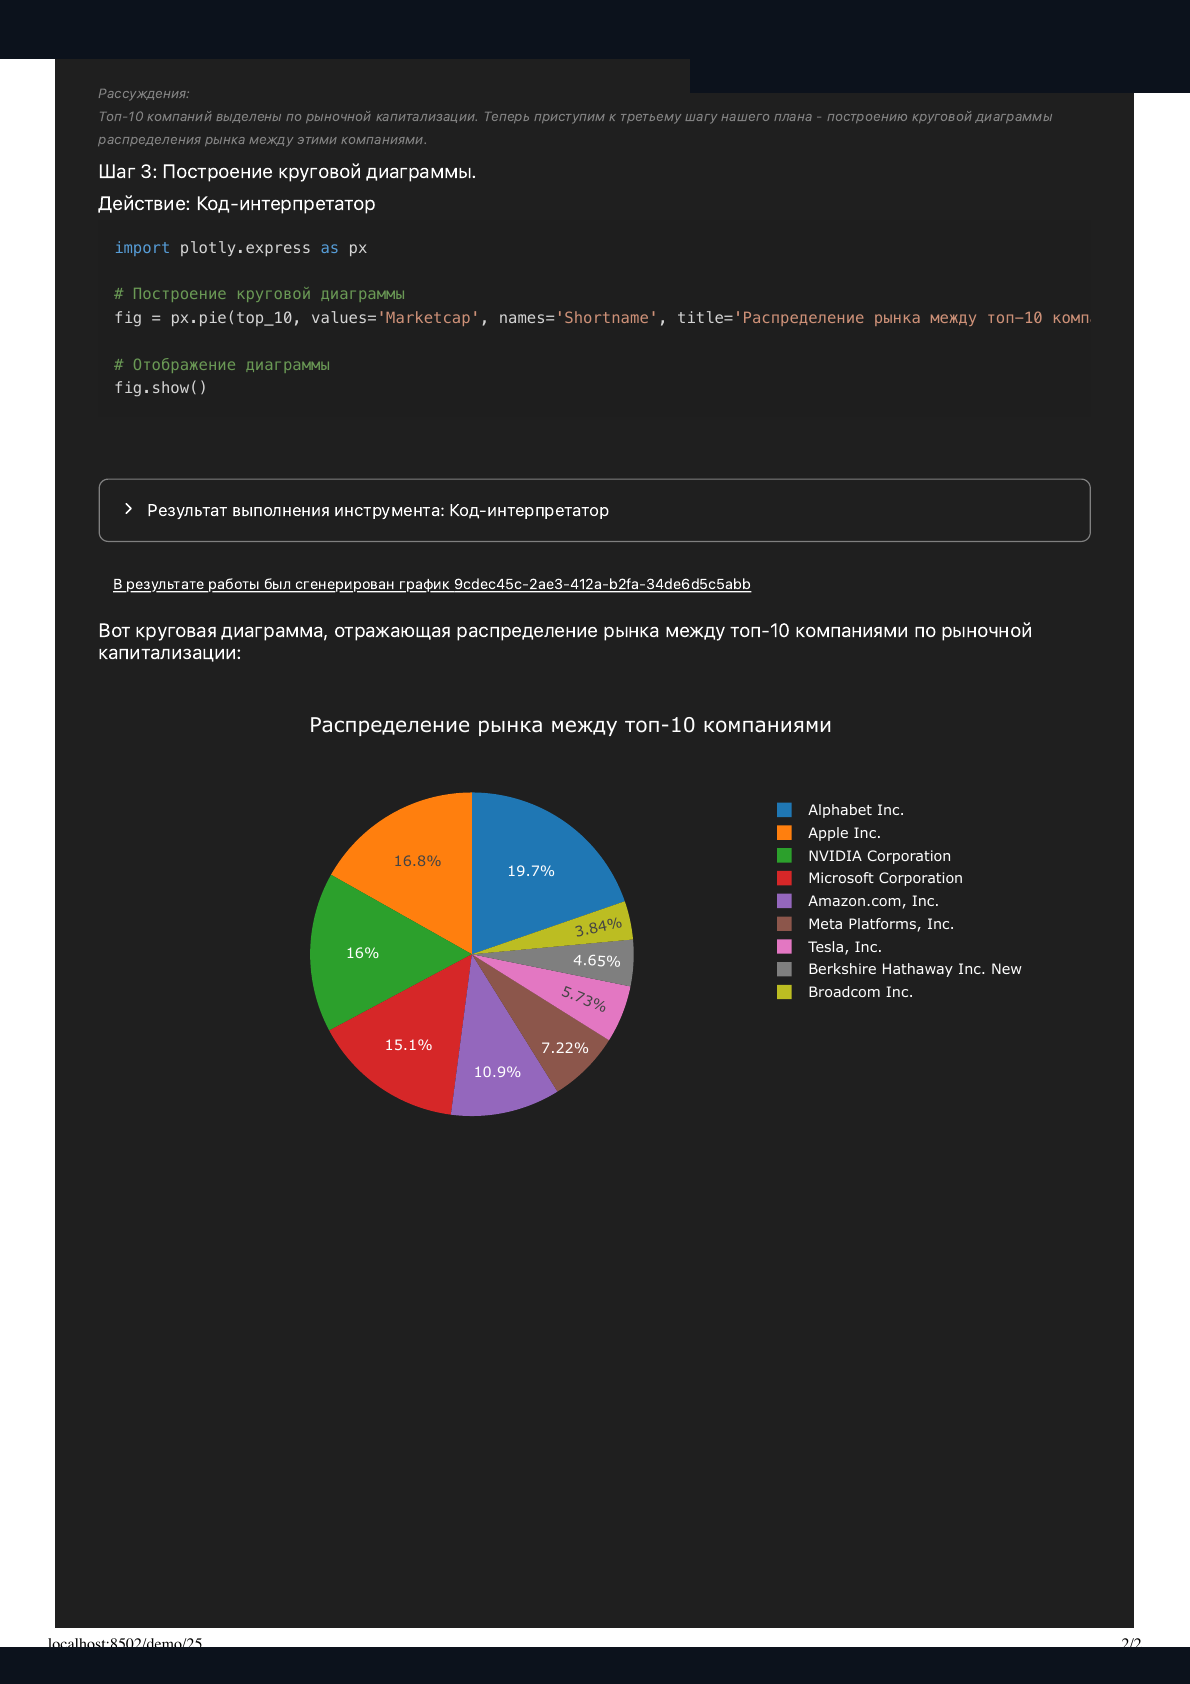
This scenario shows a user uploading a CSV or XLSX file and asking GigaAgent to build summaries, tables, and charts through Python tools.
Requirements
- Running GigaAgent.
- Configured language model connector.
- Available REPL/Python sandbox.
- A CSV or XLSX file without secrets or personal data.
Prompt example
I uploaded an Excel file with sales. Analyze it: count rows and columns, find top regions by revenue, build top-5 categories, and give three practical conclusions.
Expected result
The agent should inspect the file structure, show used columns, build a summary table, return one or more charts, and finish with concise business conclusions.
Скриншоты в галерее взяты из исторических прогонов GigaAgent и используются как иллюстрация сценария. Текущий интерфейс и точный вывод могут отличаться.